Managing compute resources > Managing Kubernetes clusters > Monitoring Kubernetes clusters
Monitoring Kubernetes clusters
If you have enabled integrated monitoring during your Kubernetes cluster deployment, that means that the cluster has the monitoring_enabled=true label and the following components installed:
- Prometheus for data collection, storage, and search:
node-exporterexposes various server-level and OS-level metrics.kube-state-metricsgenerates metrics on the state of Kubernetes objects.
- Alertmanager for alarm aggregation, processing, and dispatch.
- Grafana server for metrics visualization.
For instructions on how to create and configure Alertmanager and Prometheus instances, refer to the kube-prometheus documentation.
The Grafana server is accessible from within a Kubernetes cluster at the magnum-grafana.kube-system.svc.cluster.local DNS name and TCP port 80.
The metrics on the state of Kubernetes objects are exported at the /metrics HTTP endpoint on the listening port: magnum-kube-state-metrics.kube-system.svc.cluster.local:8080/metrics. The metrics can be consumed either by Prometheus itself or by a scraper that is able to scrape a Prometheus client endpoint. For the list of exposed metrics, refer to kube-state-metrics documentation.
Prerequisites
- A Kubernetes cluster with enabled integrated monitoring is created, as described in Creating and deleting Kubernetes clusters.
To access the Kubernetes Grafana dashboards
- On the Kubernetes clusters screen, click a Kubernetes cluster.
- On the cluster right pane, click Download kubeconfig. The .kubeconfig file will be downloaded to your client machine.
- On your client machine, install and set up the
kubectltool, to be able to run commands against Kubernetes clusters, as described in the official documentation. - Specify the path to your Kubernetes configuration file in the
KUBECONFIGenvironment variable:
# export KUBECONFIG=<path_to_kubeconfig>
5. Check that the kube-prometheus stack is installed:
# kubectl --namespace kube-system get pods -l "release=magnum"
NAME                                           READY   STATUS    RESTARTS   AGE
magnum-kube-prometheus-sta-operator-85f757c5dc-ck11b   1/1     Running   0          3017h
magnum-kube-state-metrics-5c46c5fc5f-tclcv      1/1     Running   0          3017h
magnum-prometheus-node-exporter-99kfc           1/1     Running   0          3033h
magnum-prometheus-node-exporter-gwgz7           1/1     Running   0          3017h
magnum-prometheus-node-exporter-q2pm2           1/1     Running   0          3017h
magnum-prometheus-node-exporter-sqs17           1/1     Running   0          2022h
6. Obtain the password of the admin user:
# kubectl get secret --namespace kube-system magnum-grafana \
-o jsonpath="{.data.admin-password}" | base64 --decode ; echo
7. Configure the port forwarding for the Grafana pod:
# kubectl --namespace kube-system port-forward service/magnum-grafana 3000:80
8. Log in to http://localhost:3000 under the admin user by specifying its username and password obtained in step 6.
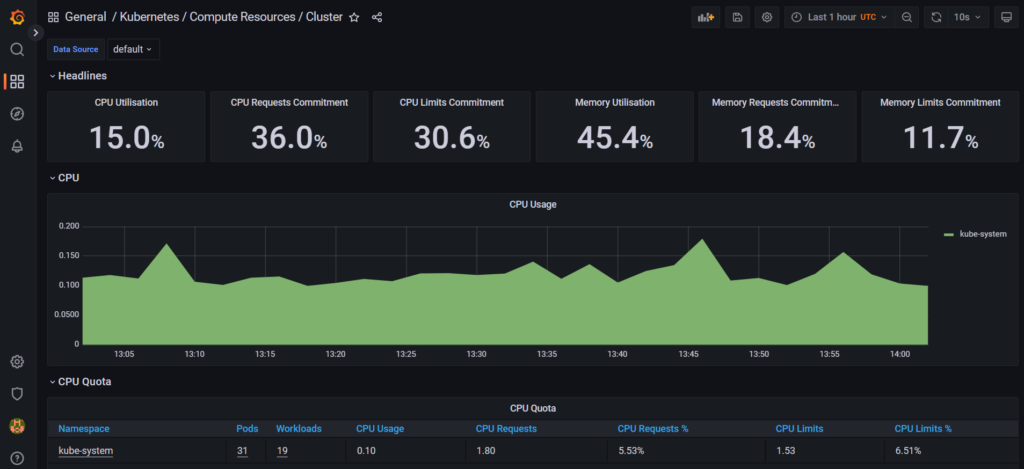
9. In the left menu, click Dashboards > Browse, and then select the dashboard you want to view.
To access the Prometheus user interface
- On the Kubernetes clusters screen, click a Kubernetes cluster.
- On the cluster right pane, click Download kubeconfig. The .kubeconfig file will be downloaded to your client machine.
- On your client machine, install and set up the
kubectltool, to be able to run commands against Kubernetes clusters, as described in the official documentation. - Specify the path to your Kubernetes configuration file in the
KUBECONFIGenvironment variable:
# export KUBECONFIG=<path_to_kubeconfig>
5. Configure the port forwarding for the Prometheus pod:
# kubectl --namespace kube-system port-forward service/magnum-kube-prometheus-sta-prometheus 9090
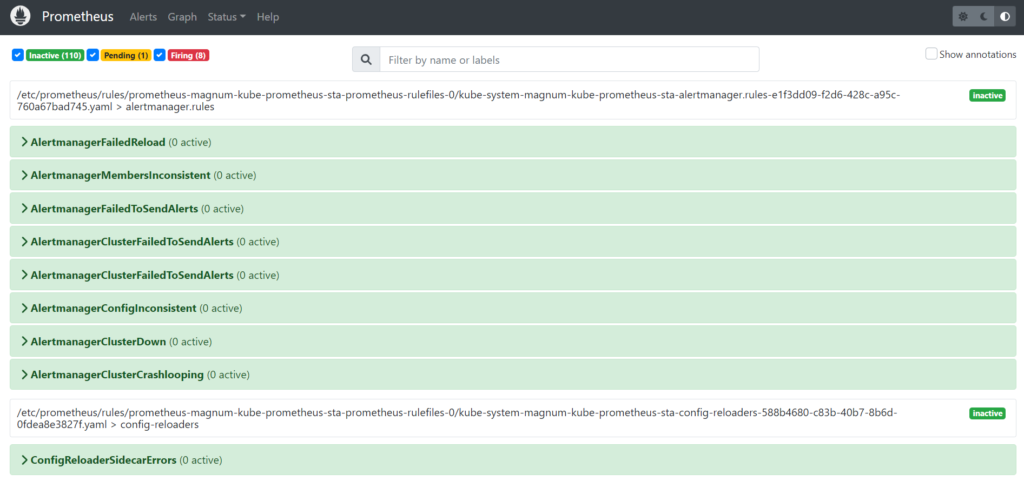
6. Visit http://localhost:9090/graph to use the Prometheus expression browser and to graph expressions. You can also navigate to http://localhost:9090/metrics to view the list of exported metrics, or http://localhost:9090/alerts to view the alerting rules.
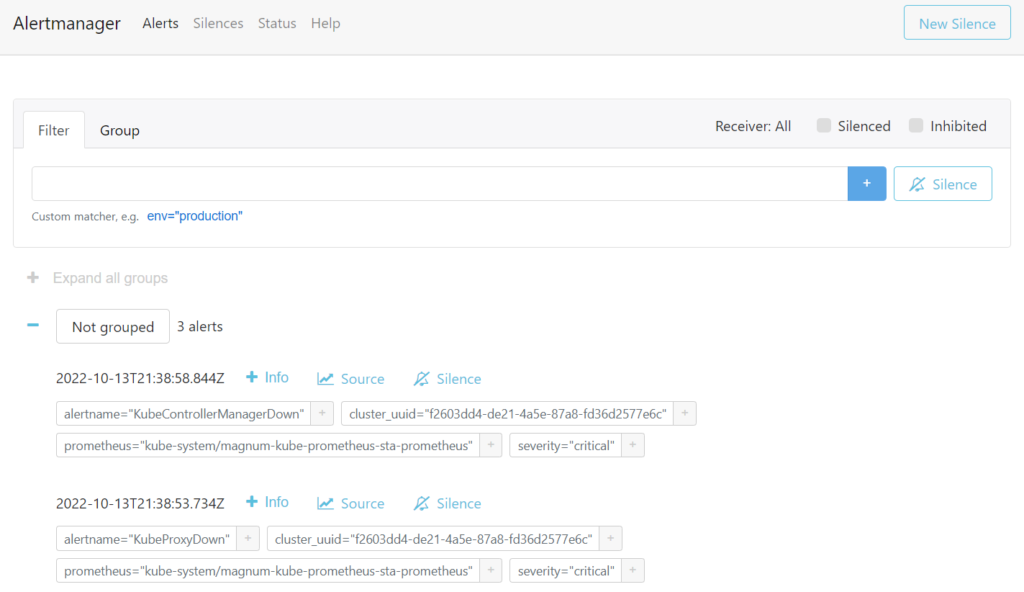
To access the Alertmanager user interface
- On the Kubernetes clusters screen, click a Kubernetes cluster.
- On the cluster right pane, click Download kubeconfig. The .kubeconfig file will be downloaded to your client machine.
- On your client machine, install and set up the
kubectltool, to be able to run commands against Kubernetes clusters, as described in the official documentation. - Specify the path to your Kubernetes configuration file in the
KUBECONFIGenvironment variable:
# export KUBECONFIG=<path_to_kubeconfig>
5. Configure the port forwarding for the Alertmanager pod:
# kubectl --namespace kube-system port-forward service/magnum-kube-prometheus-sta-alertmanager 9093
6. Visit http://localhost:9093 to access the Alertmanager user interface.